Data, Reporting & Analytics
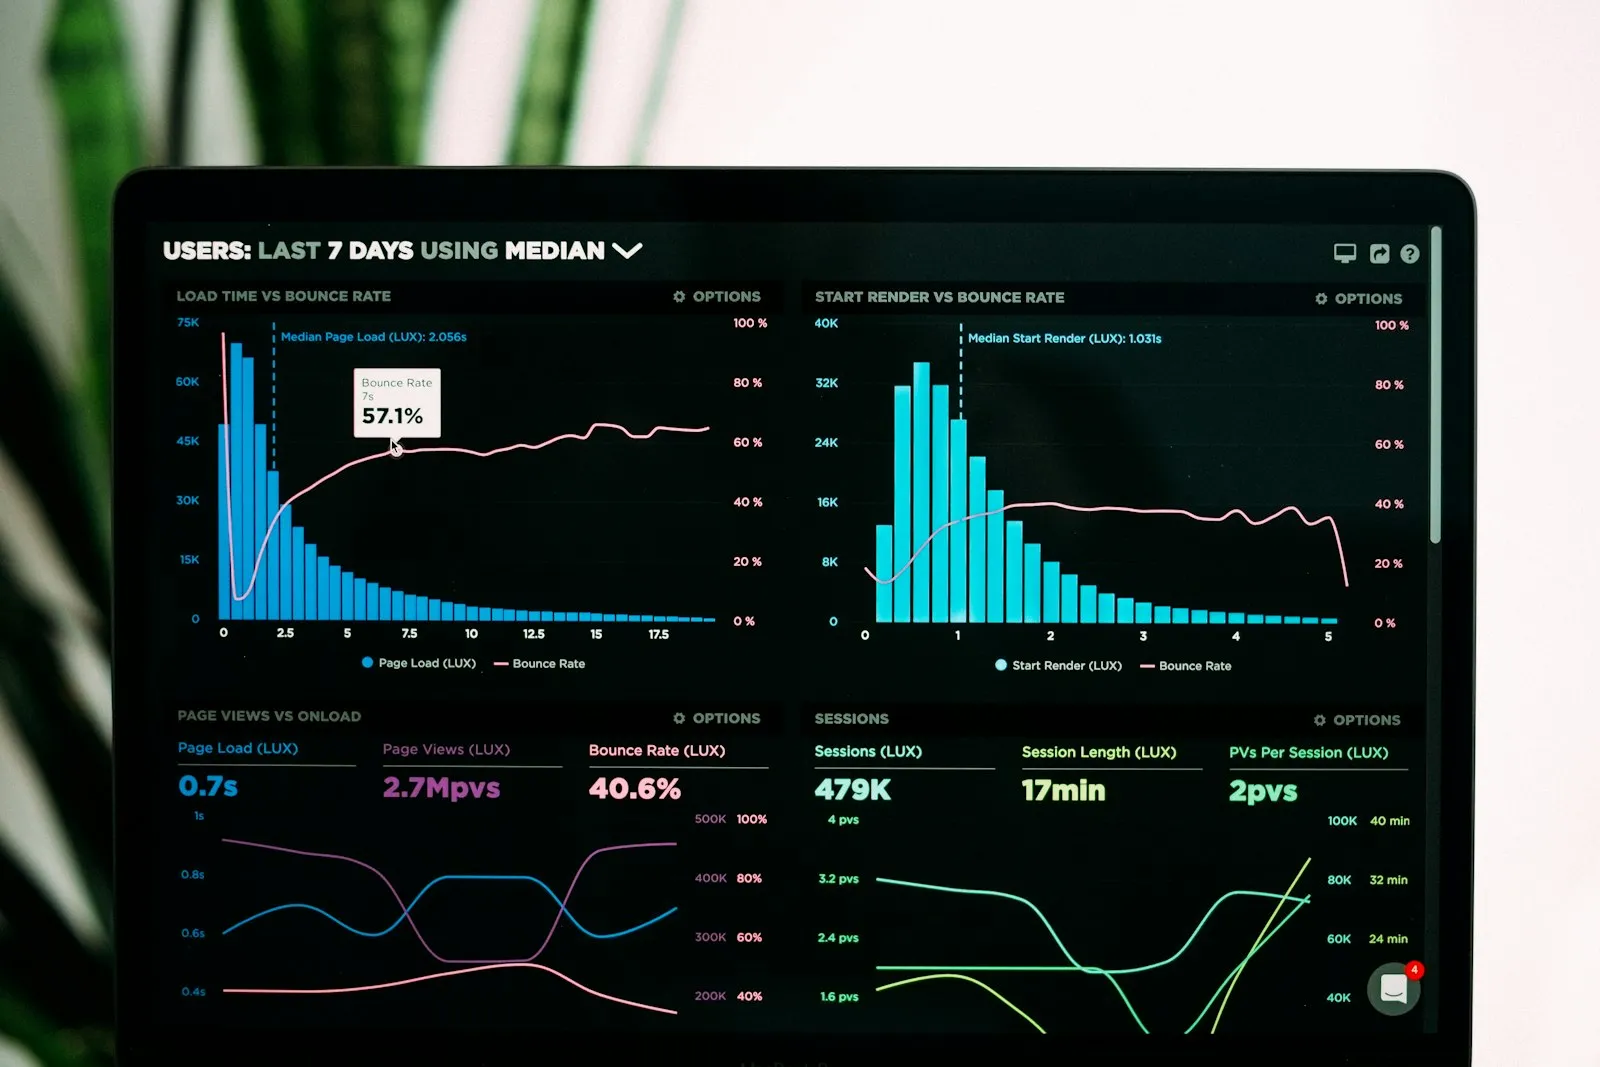
Most ERPs generate more data than anyone actually looks at, scattered across modules in formats nobody outside finance can read. We build the reporting layer, dashboards, and data governance that turn that raw data into something your leadership team opens every week instead of ignoring.
Who this is for
Organizations with an ERP that has plenty of data but no usable reporting, where decisions still get made on gut feel or a manually assembled spreadsheet.
What's included
- KPI and dashboard design for leadership and operations
- Report standardization across departments
- Data warehouse and BI tool setup
- Master data governance and cleanup
How this engagement runs
KPI definition
We work with leadership to define the handful of metrics that actually drive decisions, instead of reporting everything the system can technically produce.
Dashboard build
We build dashboards and reports against those KPIs, standardized across departments so numbers mean the same thing everywhere.
Governance handoff
We set up the master data rules that keep reporting accurate as the business changes, and train your team to maintain it.
Illustrative example, not a client case study
Example engagement: a distribution company's leadership team was reviewing three different spreadsheets, each with a different number for the same monthly revenue figure, none of which matched the ERP. A single governed dashboard sourced directly from the ERP replaced all three spreadsheets and ended the monthly reconciliation arguments.
Ready to talk about this?
Tell us where you are today. We'll tell you honestly whether this is the right starting point.